How to combine different data in one chart
Excel
2016
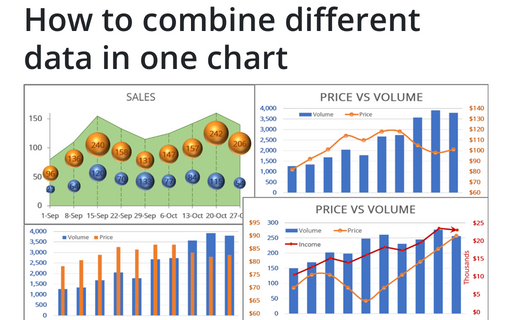
To make your data more information, you can combine different chars in many ways.
1. Combine a Bubble chart with an Area chart

See Bubble and Area chart for more details.
2. Show several axes and chart types in one chart


See Using two axes in the one chart for more details.
3. Combine two different data series with common horizontal and different vertical values


See Combining several charts into one chart in Excel 2016 and Combining several charts into one chart in Excel for Microsoft 365 for more details.
See also this tip in French: Comment combiner les données différentes dans un graphique.

