Chart in PowerPoint 365
How to create a dynamic presentation
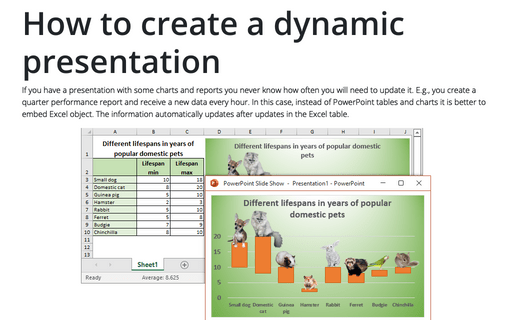
If you have a presentation with some charts and reports you never know how often you will need to update it. E.g., you create a quarter performance report and receive a new data every hour. In this case, instead of PowerPoint tables and charts it is better to embed Excel object. The information automatically updates after updates in the Excel table.
How to make a splendid circular flow chart
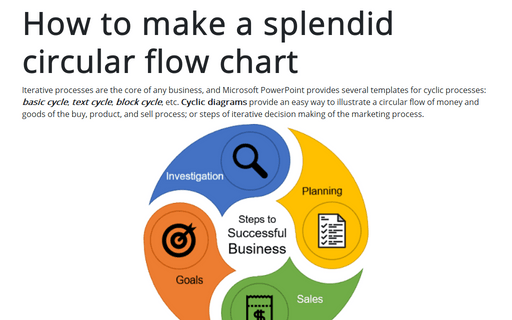
Iterative processes are the core of any business, and Microsoft PowerPoint provides several
templates for cyclic processes: basic cycle, text cycle,
block cycle, etc. Cyclic diagrams provide an easy way to illustrate a
circular flow of money and goods of the buy, product, and sell process; or steps of iterative
decision making of the marketing process.
How to tear a picture into pieces
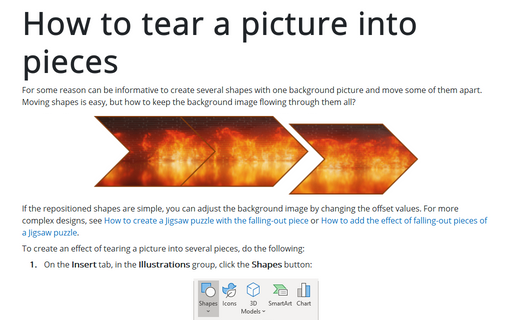
For some reason can be informative to create several shapes with one background picture and move some of them apart. Moving shapes is easy, but how to keep the background image flowing through them all?
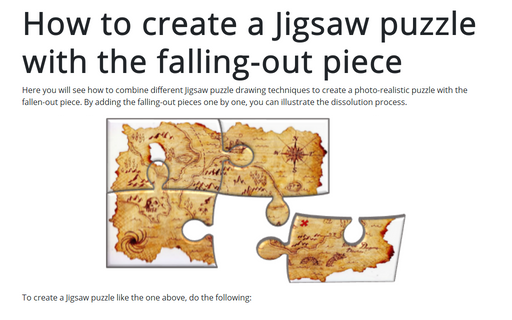
How to add the effect of falling-out pieces of a Jigsaw puzzle
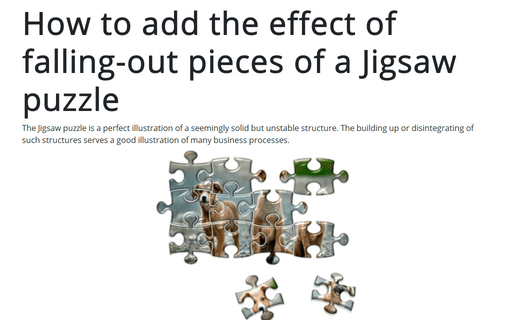
The Jigsaw puzzle is a perfect illustration of a seemingly solid but unstable structure. The building up or disintegrating of such structures serves a good illustration of many business processes.
How to create a Jigsaw puzzle with the falling-out piece
Here you will see how to combine different Jigsaw puzzle drawing techniques to create a photo-realistic puzzle with the fallen-out piece. By adding the falling-out pieces one by one, you can illustrate the dissolution process.
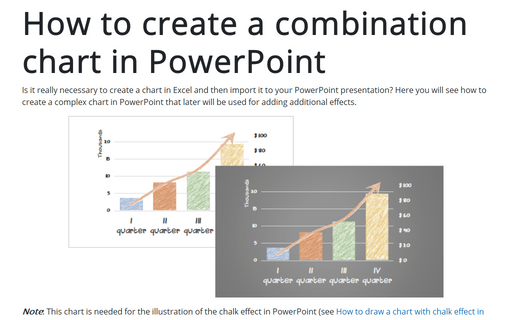
How to create a combination chart in PowerPoint
Is it really necessary to create a chart in Excel and then import it to your PowerPoint presentation? Here you will see how to create a complex chart in PowerPoint that later will be used for adding additional effects.
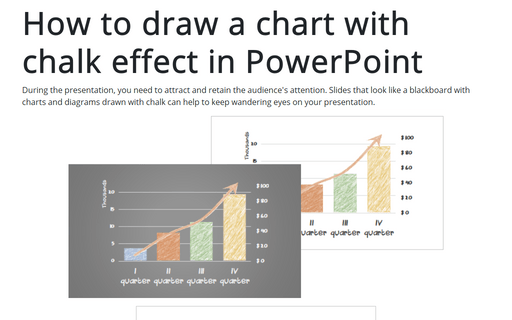
How to draw a chart with chalk effect in PowerPoint
During the presentation, you need to attract and retain the audience's attention. Slides that look like
a blackboard with charts and diagrams drawn with chalk can help to keep wandering eyes on your
presentation.
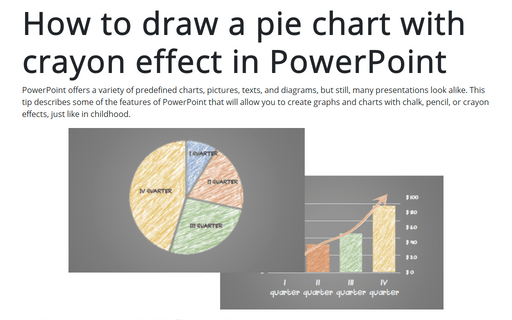
How to draw a pie chart with crayon effect in PowerPoint
PowerPoint offers a variety of predefined charts, pictures, texts, and diagrams, but still, many presentations look alike. This tip describes some of the features of PowerPoint that will allow you to create graphs and charts with chalk, pencil, or crayon effects, just like in childhood.
How to create a flowchart with chalk drawing effect
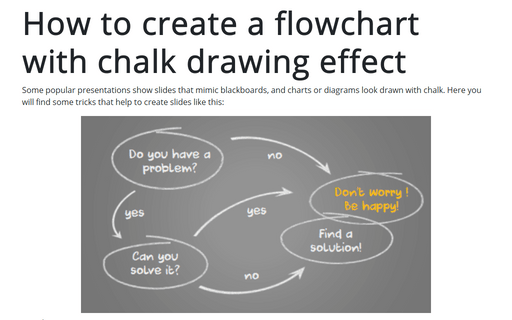
Some popular presentations show slides that mimic blackboards, and charts or diagrams look drawn with chalk. Here you will find some tricks that help to create slides like this:
How to create PowerPoint progress pie chart
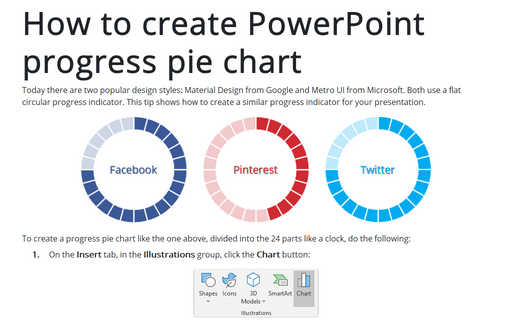
Today there are two popular design styles: Material Design from Google and Metro UI from Microsoft. Both use a flat circular progress indicator. This tip shows how to create a similar progress indicator for your presentation.
