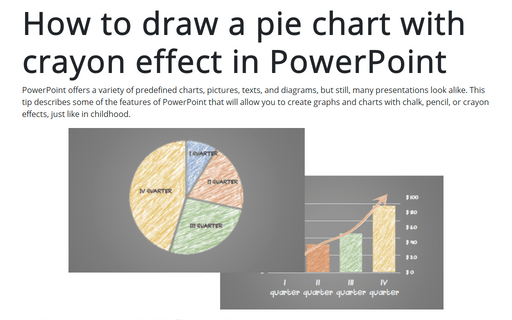
How to draw a pie chart with crayon effect in PowerPoint

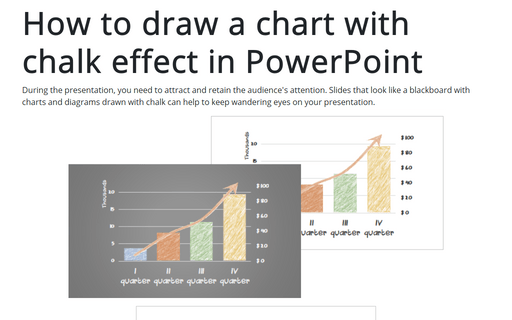
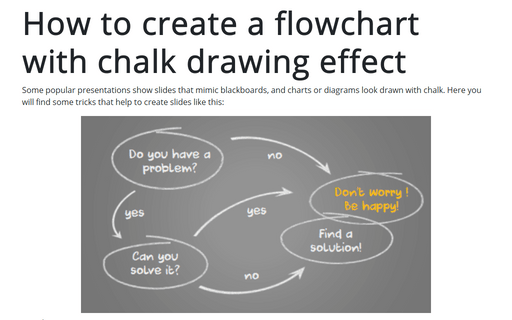
See also How to draw charts with chalk effect in PowerPoint:

To create a chart like the pie chart above, do the following:
1. Create the pie chart:
1.1. On the Insert tab, in the Illustrations group, click the Chart button:

1.2. In the Insert Chart dialog box, on the Pie tab, select the Pie chart:

1.3. In the Chart in Microsoft PowerPoint dialog box, type or insert chart data.
For this example:

PowerPoint creates a pie chart for the data:

2. Add the new shape:
2.1. On the Insert tab, in the Illustrations group, click the Shapes button:

2. In the Shapes drop-down list, in the Rectangles group, select Rectangle:

3. Select the new shape and create a picture from it:
3.1. On the Home tab, in the Clipboard group, click the Cut button (or press Ctrl+X):

3.2. On the Home tab, in the Clipboard group, click the Paste drop-down list and choose Picture:
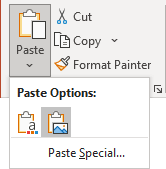
4. Make a crayon effect:
4.1. Select the picture.
4.2. On the Picture Format tab, in the Adjust group, click the Artistic Effects button:

Select the effect you like from the Artistic Effects drop-down list.
In this example is used the Pencil Grayscale effect:

4.3. On the Picture Format tab, in the Adjust group, click the Color button:

Select the color you like from the Color dropdown list under Recolor:

5. Add a crayon effect to the pie chart:
5.1. Select the picture with a colored crayon effect.
For example:

5.2. Copy the selected picture to the clipboard: on the Home tab, in the Clipboard group, click the Copy button or press Ctrl+C.
5.3. Select the first data point in the pie chart by double-clicking on it.
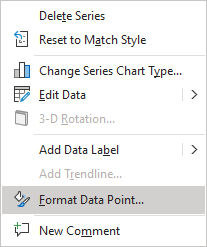
5.4. Right-click on the selected data point and choose Format Data Point... in the popup menu:
5.5. On the Format Data Point pane, on the Fill & Line tab, in the Fill section, choose the Picture or texture fill option and then click on the Clipboard button:

The first data point is ready:

6. Repeat step 4.3. to recolor the picture and steps 5 for all other data points of the pie chart:

Add labels and any other adjustments you like.
7. Customize the background color:
7.1. Do one of the following:
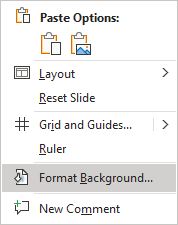
- Right-click on any empty space in the slide and choose Format Background... in the popup menu:
- In the Design tab, in the Customize group, click the Format Background button:

7.2. On the Format Background pane, on the Fill tab, in the Fill group, select:
- Solid fill and choose the color as you prefer,
- Gradient fill and choose gradient and other parameters.
In this example was used gray Preset gradient without any additional changes:

