PowerPoint 365
How to crop a picture to fit a shape
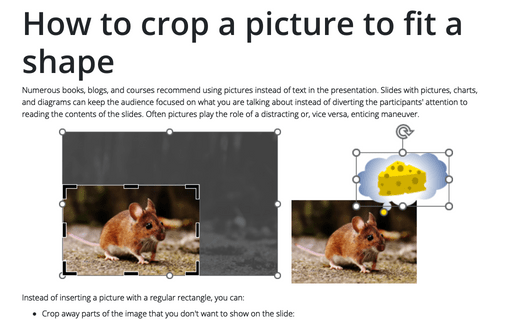
Numerous books, blogs, and courses recommend using pictures instead of text in the presentation. Slides with pictures, charts, and diagrams can keep the audience focused on what you are talking about instead of diverting the participants' attention to reading the contents of the slides. Often pictures play the role of a distracting or, vice versa, enticing maneuver.
How to lock objects from moving and resizing in PowerPoint
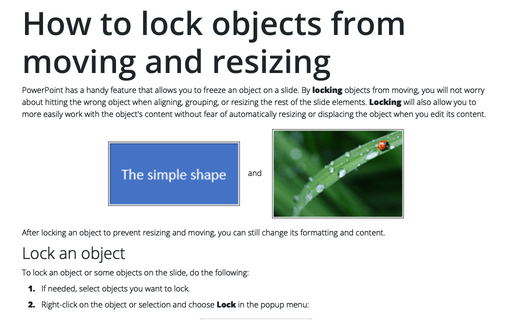
PowerPoint has a handy feature that allows you to freeze an object on a slide. By locking objects from moving, you will not worry about hitting the wrong object when aligning, grouping, or resizing the rest of the slide elements. Locking will also allow you to more easily work with the object's content without fear of automatically resizing or displacing the object when you edit its content.
Working with sections
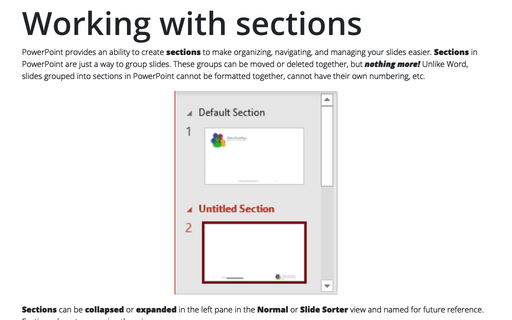
PowerPoint provides an ability to create sections to make organizing, navigating, and managing your slides easier. Sections in PowerPoint are just a way to group slides. These groups can be moved or deleted together, but nothing more! Unlike Word, slides grouped into sections in PowerPoint cannot be formatted together, cannot have their own numbering, etc.
Format tables in PowerPoint
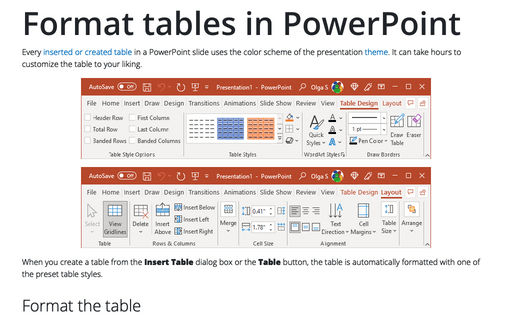
Every inserted or created table in a PowerPoint slide uses the color scheme of the presentation theme. It can take hours to customize the table to your liking.
Formatting table cells in PowerPoint
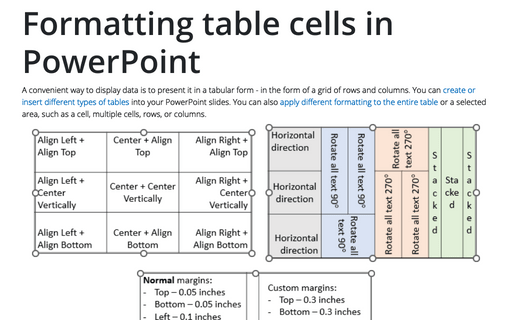
A convenient way to display data is to present it in a tabular form - in the form of a grid of rows and columns. You can create or insert different types of tables into your PowerPoint slides. You can also apply different formatting to the entire table or a selected area, such as a cell, multiple cells, rows, or columns.
Modify table structure
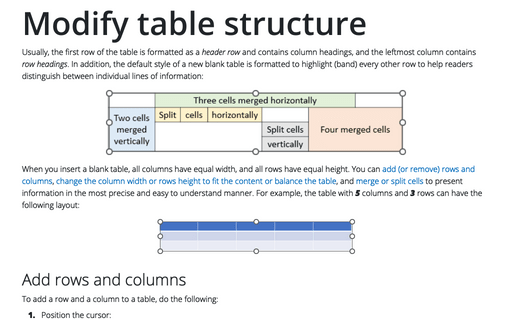
Usually, the first row of the table is formatted as a header row and contains column headings, and the leftmost column contains row headings. In addition, the default style of a new blank table is formatted to highlight (band) every other row to help readers distinguish between individual lines of information:
How to create a dynamic presentation
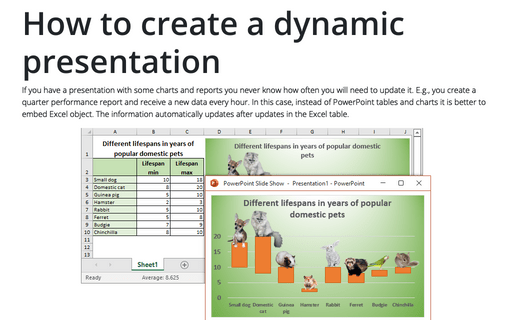
If you have a presentation with some charts and reports you never know how often you will need to update it. E.g., you create a quarter performance report and receive a new data every hour. In this case, instead of PowerPoint tables and charts it is better to embed Excel object. The information automatically updates after updates in the Excel table.
How to create or insert tables in PowerPoint
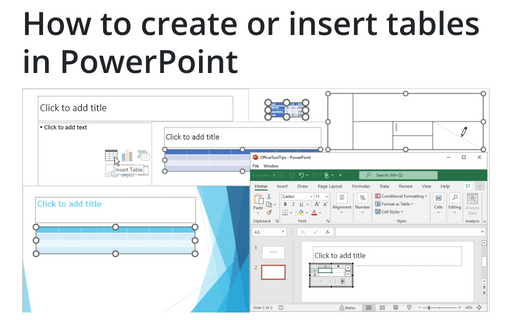
Tables are very popular objects in Microsoft PowerPoint. They present data, show the dependencies, etc. Some diagrams, such as risk and SWOT analysis, can be presented in the form of tables.
AutoFit feature
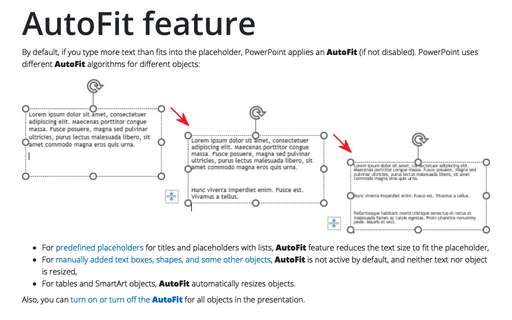
By default, if you type more text than fits into the placeholder, PowerPoint applies an AutoFit (if not disabled). PowerPoint uses different AutoFit algorithms for different objects:
Add, select, and delete text in PowerPoint
By default, every new slide in a PowerPoint presentation contains placeholders that define the type and position of objects on the slide. Usually, all slides except the presentation title/cover slide have placeholders for a slide title, one or more placeholders for a bulleted list, and one or more levels of secondary sub-lists.
