Create an organization chart with pictures

To create an organization chart using PowerPoint templates, do the following:
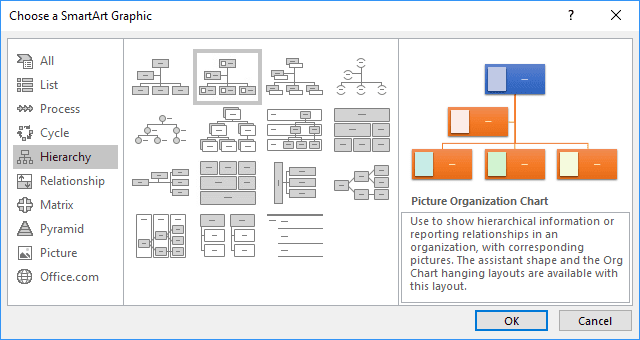
1. On the Insert tab, in the Illustrations group, click SmartArt:

2. In the Choose a SmartArt Graphic dialog box, on the Hierarchy tab, and then select Picture Organization Chart:

3. To add a picture, follow the next steps:
3.1. Select the shape and click the picture icon (or double-click picture icon):

3.2. In the Insert Picture dialog box, choose the picture location, select the picture file, and then click Insert:

Check how to format pictures in the organization chart if you will need to change pictures later.
4. To enter text, do one of the following:
4.1. Select the shape in the SmartArt graphic, and then type your text.
Note: For best results, use this option after you add all the boxes that you want because PowerPoint automatically changes sizes and layout.
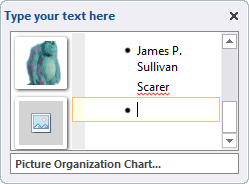
4.2. Click [Text] in the Text pane, and then type the text:

Note: If the Text pane is not visible, select the SmartArt graphic and open it by:
- clicking the control:

- clicking the Text pane button, under SmartArt tools, on the Design tab, in the Create Graphic group:

4.3. Copy text from another location or program, click [Text] in the Text pane, and then paste your text.
See also this tip in French: Comment créer un organigramme avec des images.

