How to turn on/off the Quick Analysis feature
Excel
365
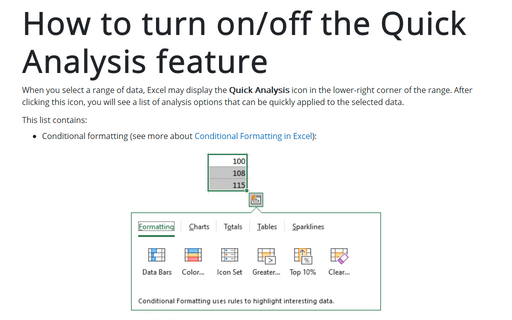
When you select a range of data, Excel may display the Quick Analysis icon in the lower-right corner of the range. After clicking this icon, you will see a list of analysis options that can be quickly applied to the selected data.
This list contains:
- Conditional formatting (see more about Conditional Formatting in Excel):

- Create a chart (see different charts)
- Add most used formulas such as Sum, Average, Count, etc.
- Create a pivot table
- Create Sparkline graphics.
The exact options vary, depending on the data in the range.
The Quick Analysis option in the local Excel can be turned off.
To turn on/off the Quick Analysis feature, follow the next steps:
1. On the File tab, click the Options button:

2. In the Excel Options dialog box, on the General tab, check or uncheck Show Quick Analysis options on selection:

Note: You can also press Ctrl+Q on the keyboard to display the Quick Analysis options.
See also this tip in French: Comment activer / désactiver la fonction d'analyse rapide.


