How to select an invisible element in the chart

You can select any chart element for customization using the ribbon tab command or from the Format *** pane.
Using the ribbon tab
1. Select the chart to display the Chart Design and Format tabs:

2. On the Chart Format tab, in the Current Selection group, click the arrow of the Chart Elements dropdown list, then select the chart element you need.
For example:

If you need to open the Format *** pane to customize the selected element, click the Format Selection button in the Current Selection group:

Using the Format pane
1. Open the Format *** pane for any of the chart elements.
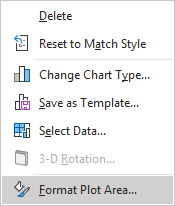
For example, right-click the chart plot area and select Format Plot Area... in the popup menu:

2. In the Format *** pane, click the arrow next to *** Options (Plot Area Options in this example) and choose the element you need to customize from the dropdown list:


