How to create blots for numbering
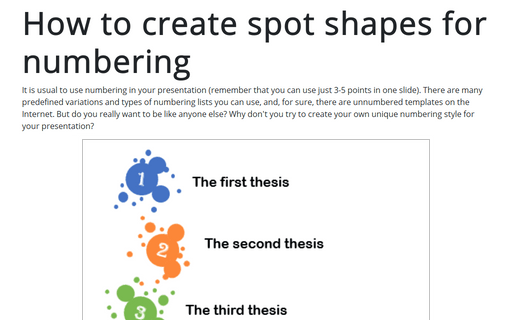
See also how to create spot shapes for numbering, how to use 3D cubes for numbering, or the numbering list.

To create blot shapes, do the following:
1. Create blots:
1.1. On the Insert tab, in the Illustrations group, select SmartArt:

1.2. In the Choose a SmartArt Graphic dialog box, on the Process tab, and then select Random to Result Process:

The new SmartArt graphic will be added to your slide:

For our new blot shape, we will need just circles.
1.3. Select just added SmartArt graphic, and then on the SmartArt Format tab, in the Arrange group, click on the Group dropdown list and select Ungroup:
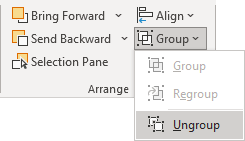
After this operation, it is not a SmartArt graphic anymore!
1.4. Select the object, then on the Shape Format tab, in the Arrange group, click on the Group dropdown list and select Ungroup. It ungroups all shapes:

1.5. Remove all shapes that don't need for this task and group circles into two different groups:

Note: To group objects, just select them, then on the Shape Format tab, in the Arrange group, click on the Group dropdown list and select Group.
See How to select and format objects in the slide with a big number of objects for more comfortable selections.
2. Create the main blot:
2.1. On the Insert tab, in the Illustrations group, select Shapes:

2.2. In the Shapes list, from the Callouts group, choose the Thought Bubble: Cloud shape:

Now you have three different shapes in your slide (one shape and two groups of shapes):

3. Format these shapes by:
3.1. Changing the connector size and position using the yellow point for the Cloud shape:

3.2. Rotating shapes by using the rotation handle at the top of the selecting border:
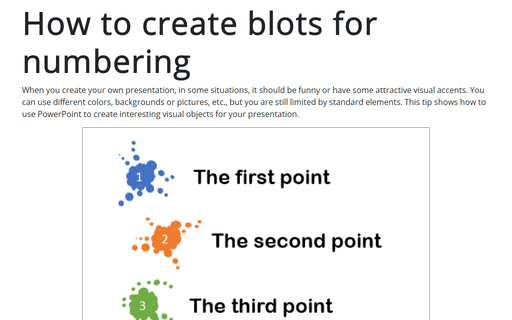
New blots will look the way you want:
 or
or
 or
or

Note: After rotation and positioning the objects, it is recommended to group them by selecting them and clicking Group (on the Shape Format tab, in the Arrange group, on the Group dropdown list):
 or
or
 or
or

3.3. Changing the fill and line color:
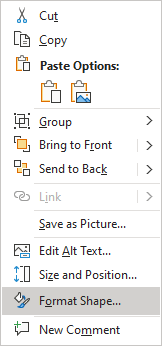
3.3.1. Right-click on the object and choose Format Shape... in the popup menu:
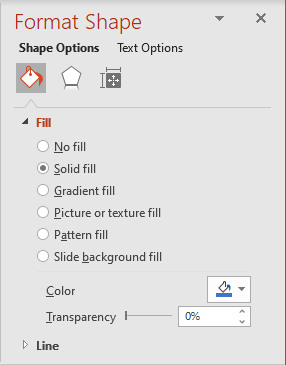
3.3.2. On the Format Shape pane, on the Shape Options tab, in the Fill & Line group:
- In the Fill section, select Solid fill or even Gradient fill, and then customize colors according to your preferences:
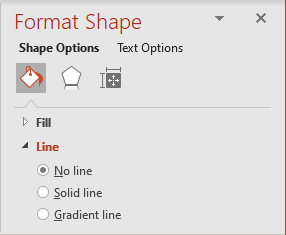
- In the Line group, select No line:
After all these changes, the shapes will look like this:
 or
or
 or
or

4. To add text to the shapes, just double-click on the shape and enter text.
See also this tip in French: Comment créer des taches de peinture pour la numérotation.
