How to create a Venn diagram in PowerPoint
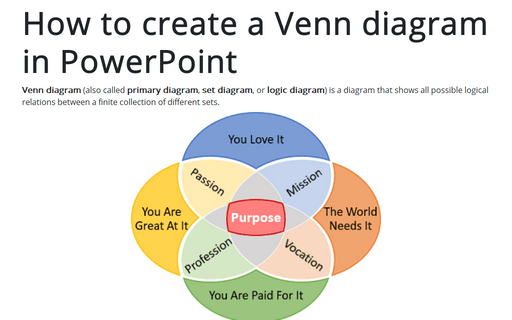
PowerPoint (like Excel and Word) proposes several different predefined SmartArt shapes that you can use for creating the Venn diagram. Still, they don't allow you to specify labels for set intersections. This tip shows how to start with the basic SmartArt Venn diagram and create more informative visualization.

To create a Venn diagram, do the following:
1. On the Insert tab, in the Illustrations group, click SmartArt:

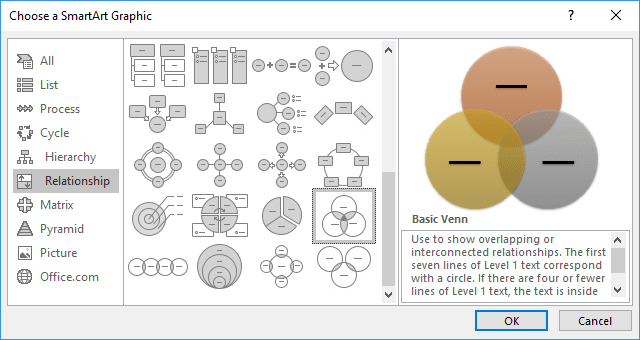
2. In the Choose a SmartArt Graphic dialog box, on the Relationship tab, and then select Basic Venn:
3. Change the number of circles by adding the fourth one and format them:

To add a new element in the SmartArt graphic, do one of the following:
- Select any circle and then under SmartArt Tools, on the Design tab, in the Create
Graphic group, click Add Shape:

- Add new circle by clicking Enter in the Text pane:

Note: If the Text pane is not visible, select the SmartArt graphic and open it by:
- clicking the control:

- clicking the Text Pane button, under SmartArt Tools, on the Design tab,
in the Create Graphic group:

- clicking the control:
4. Select all circles and then ungroup them to work with every element like with simple shape, to do that, under SmartArt Tools, on the Format tab, in the Arrange group, select the Group dropdown list and then choose Ungroup:
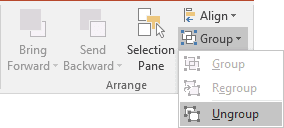
Now, all selected circles from SmartArt are not a SmartArt graphic anymore. Ungroup shapes again, and then they can be modified like usual shapes.
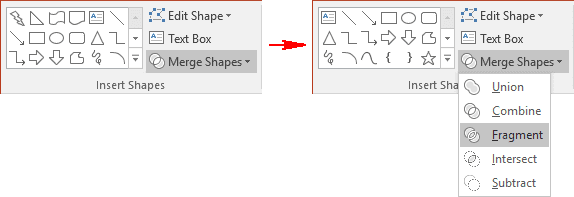
5. Select all circles and under Drawing Tools, on the Format tab, in the Insert Shapes group, select the Merge Shapes dropdown list and then choose Fragment:
6. Add texts for every shape you need:
6.1. Double-click on the shape and enter text for that shape. Then you add text to some shapes, you will see some strange formatting:

6.2. Change text formatting by doing the following:
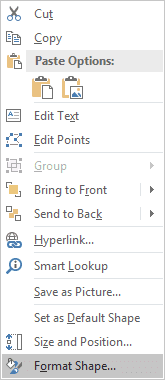
6.2.1. Select all shapes, right-click in any of them and then choose Format Shape... in the popup menu:
6.2.2. On the Format Shape pane, on the Text Options tab, in the Textbox group, in the Text Box section, correct margins:
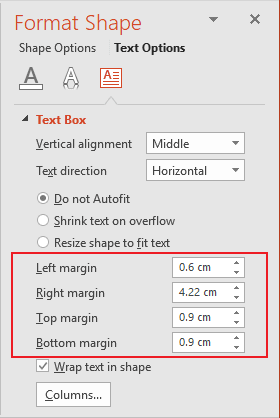
After changing margins to zeros, you will see:

7. Format all shapes like you want.
Notes:
1. To change an angle of the text, do the following:
a. Right-click in shape with appropriate text and choose Format Shape... in the popup menu.
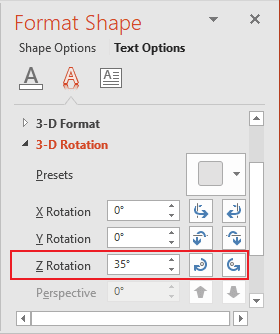
b. On the Format Shape pane, on the Text Options tab, in the Text Effect group, in the 3-D Rotation section, select the angle you prefer:
- By choosing an appropriate angle in the Z Rotation edit box or
- By clicking the buttons related to the Z Rotation options:
2. To positioning the text in shape, use margins on the Format Shape pane, in the Text Options tab, on the Textbox group, in the Text Box section.
See also this tip in French: Comment créer un diagramme de Venn dans PowerPoint.
