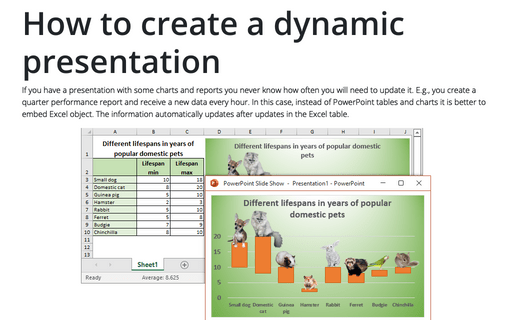
How to create a dynamic presentation

See funny and amusing charts for your next presentation in Excel.
To create a slide in the PowerPoint presentation with automatically updated data, do the following:
1. Select a chart or a table in Excel, that you want to add to the presentation and do one of the following:
- Click Ctrl+C
- On the Home tab, in the Clipboard group, click on the Copy button:

- Right-click on the selected object and then choose Copy in the popup menu.
2. Open the presentation slide, where you want to inset the Excel object and then, on the Home tab, in the Clipboard group, choose on the Paste dropdown list:
2.1. If you try to paste a chart:

In the Paste Options list, choose:
 - Use Destination Theme
& Link Data or
 - Keep Source formatting
& Link Data
Use Destination Theme will take on the theme colors, fonts, and effects of the destination presentation that you are pasting to. The source colors, fonts, and effects will be changed.
Keep Source formatting will maintain the theme colors, fonts, and effects of the presentation that you are copying from. All colors, fonts, and effects will be the same, as in the source workbook.
Link Data is what you'll use if you want the information in the chart or spreadsheet to be automatically updated when the source data is updated. A Link is created to the original and changes to the source will make the changes in the destination document.
Caution! Because this method creates a link to a specific Excel spreadsheet, if you move or delete the source file, you won't be able to update the chart.
Note: See the description for other buttons below.

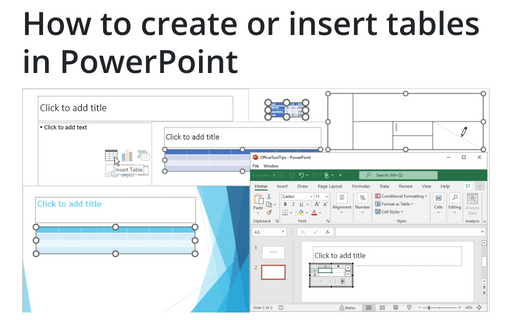
2.2. If you would like to insert a table, click Paste Special...:

Note: Any other paste option doesn't create a link to the source file, so, any changes in the Excel table doesn't update the table in PowerPoint.
In the Paste Special dialog box, check the Paste link checkbox and click OK:

Now, then you change anything in the chart or in the table, you will see changes in the PowerPoint presentation:

Other options for pasting an Excel chart:
 - Use Destination Theme
& Embed Workbook
 - Keep Source formatting
& Embed Workbook
Embed Workbook will create a copy of the data and embed it into the destination document. Future changes in the source will not be reflected. You can manually change the chart by double-clicking on it and making changes in the mini-spreadsheet that opens inside the destination document. Changes you make in the destination document also will not affect the source data. Embedding the chart and its source data is useful for sharing documents between viewer's and your own computers. However, it can create very large files.
 - Picture – the
object form the source file will be shown like a picture. Any changes in the source doesn't change
this picture. You can then edit the image like any other, but you will not be able to change or open
the source data or change the chart.
See also this tip in French: Comment créer une présentation dynamique.

