Style in PowerPoint 365
How to crop a picture to fit a shape
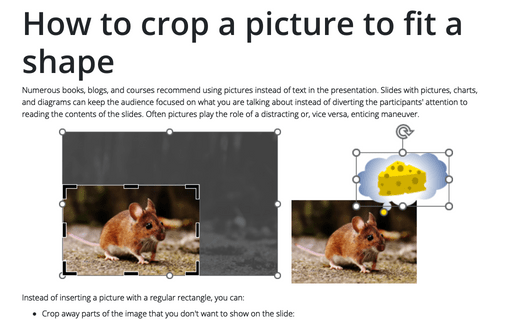
Numerous books, blogs, and courses recommend using pictures instead of text in the presentation. Slides with pictures, charts, and diagrams can keep the audience focused on what you are talking about instead of diverting the participants' attention to reading the contents of the slides. Often pictures play the role of a distracting or, vice versa, enticing maneuver.
Format tables in PowerPoint
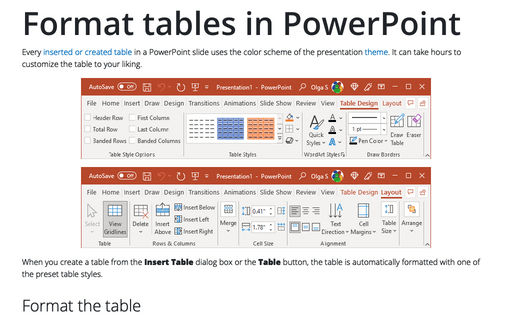
Every inserted or created table in a PowerPoint slide uses the color scheme of the presentation theme. It can take hours to customize the table to your liking.
Formatting table cells in PowerPoint
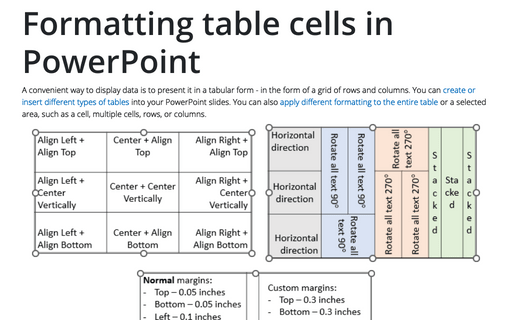
A convenient way to display data is to present it in a tabular form - in the form of a grid of rows and columns. You can create or insert different types of tables into your PowerPoint slides. You can also apply different formatting to the entire table or a selected area, such as a cell, multiple cells, rows, or columns.
Modify table structure
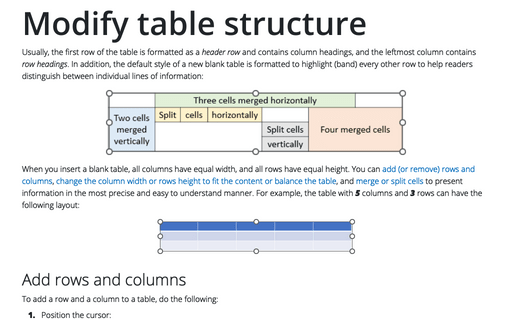
Usually, the first row of the table is formatted as a header row and contains column headings, and the leftmost column contains row headings. In addition, the default style of a new blank table is formatted to highlight (band) every other row to help readers distinguish between individual lines of information:
How to create a dynamic presentation
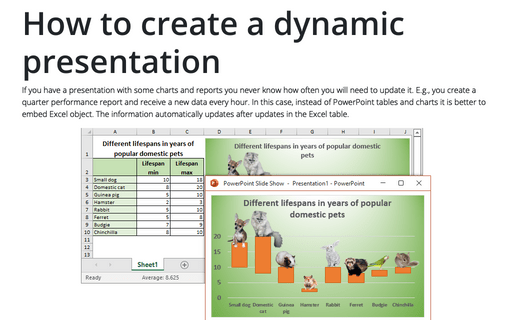
If you have a presentation with some charts and reports you never know how often you will need to update it. E.g., you create a quarter performance report and receive a new data every hour. In this case, instead of PowerPoint tables and charts it is better to embed Excel object. The information automatically updates after updates in the Excel table.
How to create or insert tables in PowerPoint
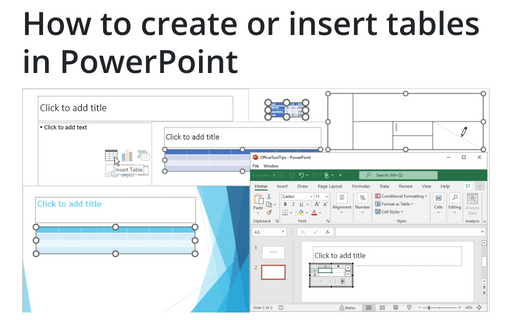
Tables are very popular objects in Microsoft PowerPoint. They present data, show the dependencies, etc. Some diagrams, such as risk and SWOT analysis, can be presented in the form of tables.
How to work with hidden slides
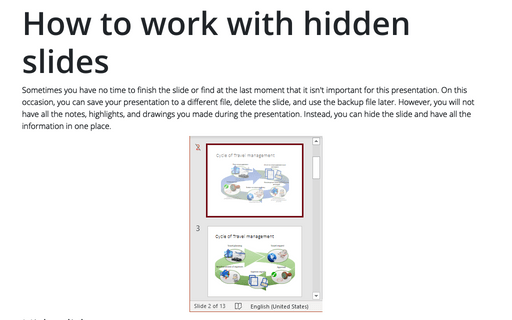
Sometimes you have no time to finish the slide or find at the last moment that it isn't important for this presentation. On this occasion, you can save your presentation to a different file, delete the slide, and use the backup file later. However, you will not have all the notes, highlights, and drawings you made during the presentation. Instead, you can hide the slide and have all the information in one place.
How to make a background with a chalk or marker effect
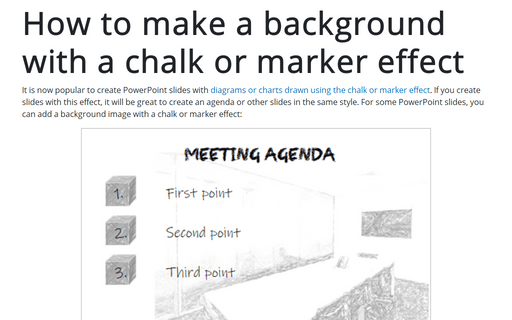
It is now popular to create PowerPoint slides with diagrams or charts drawn using the chalk or marker effect. If you create slides with this effect, it will be great to create an agenda or other slides in the same style. For some PowerPoint slides, you can add a background image with a chalk or marker effect:
How to update or change links to Excel charts or spreadsheet data in PowerPoint
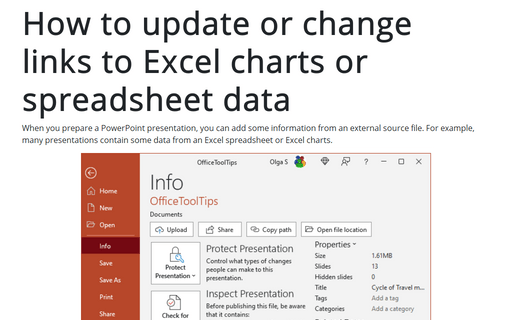
When you prepare a PowerPoint presentation, you can add some information from an external source file. For example, many presentations contain some data from an Excel spreadsheet or Excel charts.
How to create an equilateral triangle, a regular square, and other regular polygons in PowerPoint
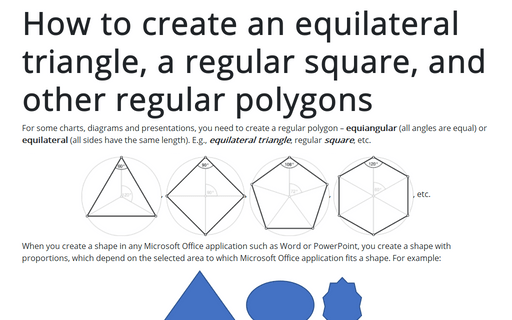
For some charts or diagrams, you need to create a regular polygon – equiangular
(all angles are equal) or equilateral (all sides have the same length).
E.g., equilateral triangle, regular square, etc.
