Flowcharts in Microsoft Office applications
Flowcharts are widely used in business, engineering, and programming to present complex processes in a concise and understandable manner. For some domains, creating a flowchart is a crucial documentation workflow stage for describing various processes, such as an administration or maintenance process or a project plan. People identify relationships, bottlenecks, dependencies, and more by creating and analyzing flowcharts.
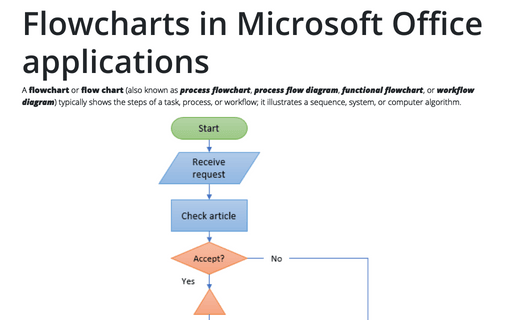
Diagrams of this kind are widely employed in documenting and communicating procedures, algorithms, and business processes and in education and training to help students and staff understand complex information:

Microsoft Office presents a variety of predefined flowcharts in Microsoft Word, Excel, or PowerPoint using the predefined SmartArt templates. Also, it allows you to create a custom variation directly in a document, spreadsheet, or presentation. Certainly, you can create diagrams in any way you like without adhering to any standards. However, the American National Standards Institute (ANSI) and International Organization for Standards (ISO) standardized building blocks and rules of flow charts. The current standard postulates the drawing direction from top to bottom and left to right and specifies symbols for different types of entities, actions, etc.
To create a flowchart in Word, Excel, or PowerPoint, do the following:
Note: To create a flowchart in Microsoft Word, you need one extra step - add a drawing canvas to put all the shapes in it.
1. On the Insert tab, in the Illustrations group, click the Shapes button:
| Word |  |
| Excel |  |
| PowerPoint |  |
2. On the Shapes list, in the Flowchart group, choose the item you need:

See below the full list of the Flowchart shapes with their description.
3. To add text in the selected shape, just double-click the shape and enter the text.
4. To connect shapes, on the Insert tab, in the Illustrations group, click on the Shapes list and then select one of the connectors in the Lines group:

See below the full list of the Flowline shapes with their description.
Almost all shapes have connection points, the special anchors to which connectors can be attached (or glued). The connection points are displayed as small gray circles:

Note: Connection points only become visible when you select any connector and try to connect one shape to another. Connection points become visible on hovering over the selected line next to the shape.
The connection between a shape and a connector is established, and the gray circle of the connector turns green. The connection attaches to the shape, so it will move with the shape when you move one of the attached shapes. Make sure the start and end of the connection are always shown in green:

Otherwise, when moving shapes, unconnected points hang loosely:
- Attached is the arrow connecting both shapes:

- Loose is the arrow connecting only to one connection point:

Note: Word, Excel, and Powerpoint are not specialized flowchart applications like Visio, so they do not have a tool for creating dynamic connections (a dynamic connection is a connection where the connector flows around the shape as it moves). Sometimes you have to reconnect or reroute connections after moving shapes.
5. Select other shapes from the Shapes list to create an additional effect. See some examples below.
List of Flowchart shapes
From the Shapes list, in the Flowchart group, select the shape required for the specific item of the flowchart:

Process shape
Process shape is a rectangle with square corners that represents a step of a process, action, or operation:

This shape represents a general step in which something needs to be done - action. So, this is the most frequently used shape in almost every process. The text in this rectangle should include a verb, for example: "Fix the problem", "Test", or "Try again":

Alternative Process shape
Alternative Process shape is a rectangle with round corners (rounded rectangle) that represents a process step that is an alternative to the normal process step:

Often, this shape is used for an automated activity that happens faster than the conventional Process:

Decision shape
Decision shape is a diamond that represents a decision to be made - condition:

This shape indicates the question to be answered. Usually, only two answers are used: Yes and No, or True and False. Multiple answers are also allowed but not recommended – there are flow diagrams with a third answer, such as Maybe or No answer.
The answer to the question determines the arrow coming from the diamond, usually:
- An arrow at the bottom point corresponds to the answer Yes or True,
- An arrow at the right/left point corresponds to the answer No or False.
Remember, arrows should always be labeled to avoid confusion during the process:

Data shape
Data shape (also known as Input/Output) is a parallelogram with parallel top and bottom lines and slanted to the right left and right edges. This shape illustrates the input or output from the data source.

This shape indicates that information enters the process from outside or leaves the process. For example, receiving some information, sending a report, generating an invoice, receiving or sending an email, etc.:

Note: Previously, the paper tape symbol ![]() was used to indicate the input/output of information, but it is outdated and is no longer used for creating flowcharts.
was used to indicate the input/output of information, but it is outdated and is no longer used for creating flowcharts.
Predefined Process shape
Predefined Process shape (also known as Subroutine) is a rectangle with two parallel vertical lines near the left and right sides representing an already defined process. This shape refers to a sub-process or operation that is well-known or defined elsewhere, often on a different page of the same document:

This shape can represent some reusable program-within-a-program and is typically used to simplify complex flowcharts by moving a large portion of a flowchart or frequently repeated actions to another flowchart:

Note: You can add a hyperlink in this shape to another flowchart.
Internal Storage shape
Internal Storage shape is a rectangle with two lines intersecting in the upper left corner that indicates data that is stored within the internal memory (as opposed to on a file):

This type of flowchart is commonly used in software development flowcharts and indicates that data/information is stored in memory during program execution.
Document shape
Document shape is a rectangle with a wave-like base that represents data or information that can be read by people - specifically, it represents the input or output of a document or even a printed document:

This shape represents an action that produces a document, such as generating a presentation, memo, or letter:

Multiple Document shape
Multiple Document shape is a series of rectangles with a wave-shaped base that represents multiple documents or reports:

For example:

Terminator shape
Terminator shape (also known as Start/End) is a rounded-corner rectangle that represents the start and end of a process:

This shape sometimes uses to mark potential outcomes of a path but usually uses for the first and last step of the process and contains Start (Begin) or End within the shape:

Preparation shape
Preparation shape (also known as Manual Loop) is a wide hexagon that represents a preparation step or setup:

This shape indicates that something needs to be customized, changed, or adjusted in the process before proceeding further:

Manual Input shape
Manual Input shape is a rectangle with the top sloping up from left to right that represents a process step that a person will manually perform:

Usually, this shape denotes an action in which the user (operator, customer, etc.) is asked to enter some information manually into the system. For example, a login step requires entering a username and password to identify the client.
Manual Operation shape
Manual Operation shape is a trapezoid (trapezium) with parallel greater top and smaller bottom lines and left and right congruent (isosceles) lines. This shape represents any operation or adjustment that must be performed manually rather than automatically:

Usually, this step indicates a non-automated process, such as preparing testing data:

On-Page Connector shape
On-Page Connector shape is a small cycle representing a breakup in the process flow, indicating that the next (or previous) step is somewhere else in the drawing. This shape is commonly used in complex flowcharts to separate elements on the same page:

This shape is especially useful for large flowcharts instead of a long connector that can be difficult to follow. Such shapes may contain text within the shape to pair them up:

Note: You can add a hyperlink in this shape to another one.
Off-Page Connector shape
Off-Page Connector shape is a small square with an arrow-shaped bottom line pointing down (or pentagon). Note that such Off-Page connectors can be rotated to indicate the direction of the other page. This shape represents a breakup in the process flow, indicating that the next (or previous) step is on another page:

The Off-Page Connector shape with the ingoing arrow indicates the end of the process on this page, and the Off-Page Connector with the outgoing arrow indicates the start of the process on the page. Such shapes may contain text (a letter or page number) within the shape to pair them up:

Note: You can add a hyperlink from this shape to another one.
Card shape
Card shape is a rectangle with the upper left corner cut off (representing an old IBM-computer-style punch card) indicates that data is entered using cards:

This shape is rarely used in the modern flowcharts.
Punched Tape shape
Punched Tape shape (also known as a Perforated Paper Tape or Paper Tape shape) looks like a waving flag and indicates that data is stored on a punched tape or perforated paper tape - a long strip of paper in which holes are punched:

This shape is an outdated symbol rarely used in modern process flows. For example, it can be used in computer numerical control (CNC) router processes.
Summing Junction shape
Summing Junction shape is a small circle with two diametrical lines intersecting at right angles, forming a figure like a large letter X inside. This shape is used to represent the logical AND gate that sums up data from multiple converging process paths:

The summing junction shape always has multiple incoming arrows (at least two) and one outgoing arrow.
Or shape
Or shape is a small circle with two diametrical lines intersecting at right angles, forming a large plus or cross inside. This form is used to represent the logical OR: indicates that the process flow diverges for more than two arrows:

The Or shape always has one incoming arrow and several outgoing arrows.
Collate shape
Collate shape looks like a triangular hourglass that represents a process step that requires the organization of data, information, or materials in a standardized format or arrangement:

Standardization can be helpful to ensure data consistency.
Sort shape
Sort shape is a rhombus with a horizontal line crossing it in half (or a bisected kite) that represents a process step that organizes data, information, or materials in a particular order:

Extract shape
Extract shape is an equilateral triangle with a flat base that represents a step that divides the process into parallel paths:

The extract shape has one incoming arrow and several outgoing arrows (see an example above).
Merge shape
Merge shape is an equilateral triangle with a flat top that represents a step that merges several paths into one process:

The merge shape has several incoming arrows and just one outgoing arrow (see an example above).
Stored Data shape
Stored Data shape (also known as a Data Storage shape) looks like the visible part of an empty can (cylinder) side lying on its side. This shape represents a step where a process stores data:

The data may be stored on a hard drive, magnetic tape, memory card, or any storage device.
Delay shape
Delay shape is an elongated half-oval that indicates a delay or a pause before the process flow continues:

This step often indicates waiting for approval, signing, completion of the printing process, saving data, etc. In other words, the completion of an alternative, dependent, or any other process step, without which it is inappropriate to continue the next steps of the process:

Sequential Access Storage shape
Sequential Access Storage shape looks like a reel of tape that represents information stored in a sequence, such as data on a magnetic tape:

This shape is rarely used in modern flowcharts.
Magnetic Disk shape
Magnetic Disk shape (also known as a Database shape) look like a can (cylinder) and represents data or information stored in the storage device that allows users to search, filter, and sort:

Direct Access Storage shape
Direct Access Storage shape (also known as a Hard Disk shape) looks like a filled can (cylinder) lying on its side and represents where data is stored within a hard drive, also known as direct access storage:

Display shape
Display shape looks like the shadow of a short pencil and represents a step where some data is displayed to be read on a screen or display:

List of Flowline shapes
From the Shapes list, in the Lines group, select the line you need:

Arrow
Arrow connects two shapes and represents the connection between two steps and the direction of flow:
Arrows are the most popular flowchart connectors, but they represent the shortest distance between two connection points, often breaking flowchart design principles.
Double Arrow
Double Arrow (also known as double-headed arrow) indicates interactions between individual modules:
Usually, instead of a thin double arrow, is used the Arrow: Left-Right or Arrow: Up-Down shape from the Block Arrows group:
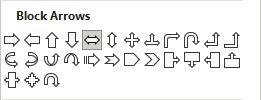
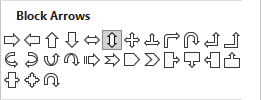
Note: These shapes, Arrow: Left-Right and Arrow: Up-Down, as well as all other arrows from the Block Arrows group do not allow to connect shapes.
Elbow Arrow Connector
Elbow Arrow Connector is an S-shape that can connect shapes with a multi-step line. This arrow is most often recommended for creating standard flow charts:

Curved Arrow Connector
Curved Arrow Connector (also known as an Arc connector) is a portion of a circle ending in an arrow:

This variant of flowchart connectors allows designers to create complex flowcharts that violate the rules of linearity. Often such connectors are used to connect unrelated steps in a flowchart according to the actual or alternative operation of a system or process. These connectors can also display interdependent events that occur outside the illustrated process but which can significantly affect decision-making on this process:

Some additional useful shapes for Flowcharts
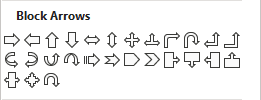
1. From the Block Arrow group of the Shapes list, select the shape to display non-connected relationships between some flowchart blocks or areas:
2. From the Basic Shapes group of the Shapes list, choose:
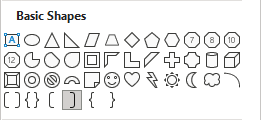
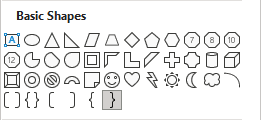
Right Bracket or Right Brace
Right Bracket shape and Right Brace shape (also known as Comment / Note symbol) are used to add necessary explanations or comments and placed along the flowchart:
To add text next to any of these shapes, you need to add a text block. For example:

Callouts
Instead of the Right Bracket and Right Brace shapes, with the same purpose can be used one of the callout shapes from the Callouts group of the Shapes list:

See how to add callouts to objects for more details.
Further Reading
You may need to add or modify individual components if you work with flowcharts. The following links to the articles may help you understand and customize the flowcharts:
