How to add separators to the Marimekko chart

To add horizontal separators (lines) to the chart, do the following:
1. Right-click on the data series and choose Format Data Series... in the popup menu:

2. On the Format Data Series pane, on the Fill & Line tab, in the Border section, select the Solid line radio button and choose the color and width in the appropriate fields:

3. Repeat previous steps for all data series in the chart:

To add vertical separators (lines), do the following:
Note: Instead of the following steps, you can add the new data series for the vertical lines and format them (see How to add a vertical line to the chart).
4. Select the chart.
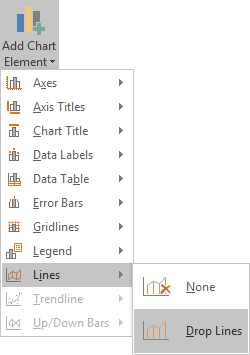
5. Under Chart Tools, on the Design tab, in the Chart Layouts group, click the Add Chart Element dropdown list, then select the Lines list and then Drop Lines:

6. Right-click on any of the drop lines and choose Format Drop Lines... in the popup menu.
7. On the Format Drop Lines pane, on the Fill & Line tab, in the Line section, select the Solid line radio button and choose the color and width in the appropriate fields (repeat the same color and width as for the data series borders):

The mosaic part is done:

To add labels to the chart, see the last part of this tip How to add labels to the Marimekko chart in Excel.

