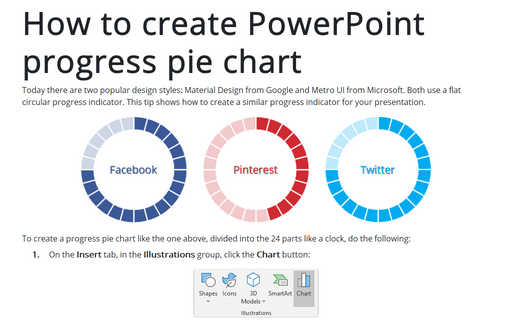
How to create full circle progress charts in PowerPoint
See also How to create an Arc length chart in PowerPoint.

To create a full circle progress pie chart, do the following:
1. On the Insert tab, in the Illustrations group, click the Chart button:

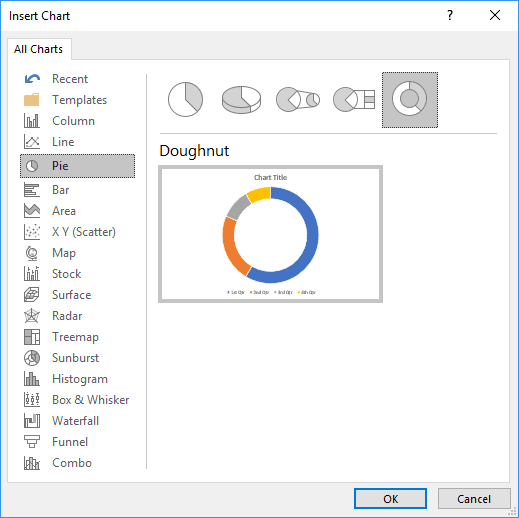
2. In the Insert Chart dialog box, on the Pie tab, choose the Doughnut chart:

3. In the Chart in Microsoft PowerPoint dialog box, enter the data stream with the values and the formula (=100-values):

4. Change the width of the pie chart:
4.1. Right-click on your chart data and choose Format Data Series... in the popup menu:

4.2. In the Format Data Series pane, on the Series Options tab, choose the volumes of the Doughnut Hole Size field:

5. Customize the Values data:
5.1. Right-click on the values data and select Format Data Point... in the popup menu:

5.2. In the Format Data Point pane, on the Fill & Line tab:
- In the Fill section, choose Solid fill and select the color you prefer:

- In the Border section, choose Solid fill,
select the color you prefer and increase the width in the Width field:

6. Customize the Rest data:
Open the Format Data Point pane for the Rest data point and on the Fill & Line tab:
- In the Fill section, choose Solid fill and select the color as for the Values data
- In the Border section, choose No line:

Make any other adjustments to get the look you want.
See also this tip in French: Comment créer le graphique de cylindrique annulaire dans PowerPoint.

