How to create a flowchart with SmartArt
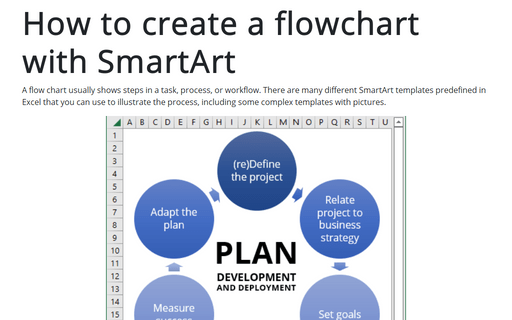
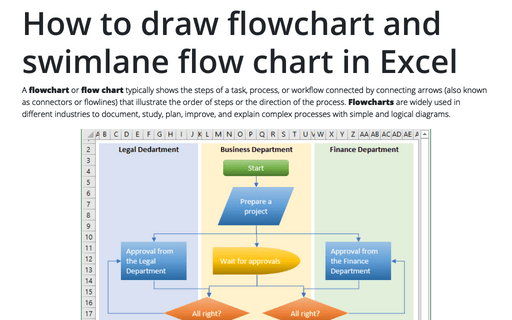
Sure, it is very easy to create your own flow chart using a predefined template (see how to draw a flowchart in Excel).

To make the chart using SmartArt tools, do the following:
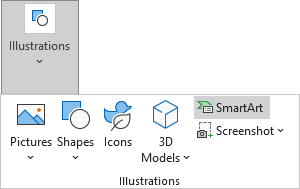
1. On the Insert tab, in the Illustrations group, select SmartArt:

2. On the Choose a SmartArt Graphic dialog box, in the Cycle group, choose the item that you prefer (in this example has been chosen Basic Cycle):

3. To enter a text in the shapes, do one of the following:
- Just double-click in shape and enter the text:

- Click on the Text Pane arrow in the SmartArt graphic and type texts in the Text Pane:

- On the SmartArt Design tab, in the Create Graphic group, click the Text Pane button:

4. To make adjustments for your graphic, you can use Excel SmartArt instruments:
4.1. On the SmartArt Design tab, in the SmartArt Styles group:

- Select colors from the Change Colors dropdown list:

- Select the SmartArt style you prefer:

4.2. To change the size of all shapes in your graphic, do the following:
- Select all shapes which you would like to resize by dropping the Ctrl button and selecting all shapes:

- On the SmartArt Format tab, in the Size group, change sizes for all selected shapes:

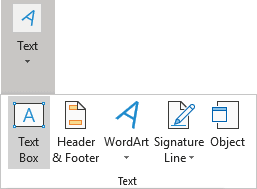
5. To add text in the center of the graphic, just add the Text box in it - on the Insert tab, in the Text group, click the Text Box button:

See also this tip in French: Comment créer un diagramme à l’aide de SmartArt.

