Competition chart with residual data

To create the chart like this one, do the following:
1. Add additional data to your chart to see the residual data (in this example, cells C17:D17).
2. Select all necessary data - in this example, C4:D4, C15:D15, C17:D17:

3. On the Insert tab, in the Charts group, choose the Column button:

Choose the 100% Stacked Column
 chart.
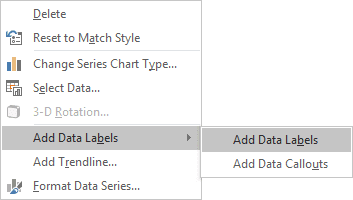
4. Right-click on the second data series, then in the popup menu, select Add Data Labels and again Add Data Labels:

Make any other adjustments to get the look you desire. See more:
See also this tip in French: Créer un graphique de concurrence avec des données résiduelles.

