How to view historical stock prices and currency rates in Excel

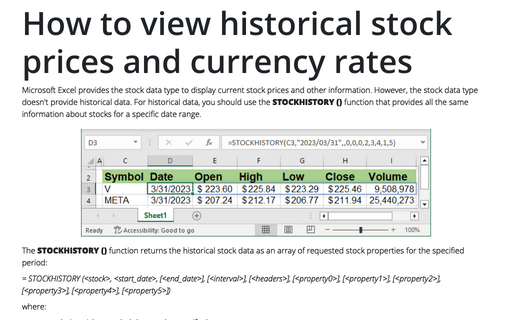
The STOCKHISTORY () function returns the historical stock data as an array of requested stock properties for the specified period:
= STOCKHISTORY (<stock>, <start_date>, [<end_date>], [<interval>], [<headers>], [<property0>], [<property1>], [<property2>], [<property3>], [<property4>], [<property5>]),
where:
- <stock> is a ticker symbol that can be specified:
- in double quotes, e.g., "VISA"
- as a cross-reference to the cell with the ticker symbol
- result of some function.
- <start_date> is the date for which you need to return the stock price or the first date of the date range:
- in double quotes, e.g., "2023/03/31"
- as a cross-reference to the cell
- result of some functions, e.g., TODAY ().
The formula TODAY () calculates the current date.
- <end_date> (optional) is the end date of the date range, by default, is <stock>.
- <interval> (optional) defines which values need to return:
- 0 = daily (used by default),
- 1 = weekly,
- 2 = monthly (see an example for currency exchange rates).
- <headers> (optional) specifies how to display headings:
- 0 = no headers,
- 1 = show headers (used by default),
- 2 = show instrument identifier and headers.
- <property0> - <property5> (optional) specifies which columns to display for each ticker symbol:
- 0 = date:
- If <interval> is daily or weekly, the first valid trading day in the period
- If <interval> is monthly, the first day of the month, regardless of if it was a trading day
- 1 = closing price - Closing price on the last trading day in the period,
- 2 = opening price - Opening price on the first trading day in the period,
- 3 = high price - Highest day's high in the period,
- 4 = low price - Lowest day's low in the period,
- 5 = Volume traded - Number of shares traded during the period.
If any of these parameters are present, only the specified columns are returned in the specified order. The default values are 0,1 - Date and Closing price.
- 0 = date:
Return closing prices for the period
By default, the STOCKHISTORY () function returns the array of
- two columns (the default values of <property0> - <property5> - 0,1) Date and Closing price,
- rows of each date from the specified period (the default value of <interval> - 0 = daily) plus one row for headers (the default value of <headers> - 1 = show headers).
For example:

Return closing prices for one date
To return only the closing price for the specified date, use the following parameters:
= STOCKHISTORY (<stock>, <start_date>, , 0, 0, 1),
where:
- <end_date> is skipped to return data only for <start_date>,
- <interval> can be skipped or set to 0 = daily,
- <headers> set to 0 = no headers,
- <property0> set to 1 = closing price.
For example:

Return full information for the period
To return full daily data for the specified period, use the following parameters:
= STOCKHISTORY (<stock>, <start_date>, <end_date>, 0, 0, 1),
where:
- <interval> can be skipped or set to 0 = daily,
- <headers> can be skipped or set to 1 = show headers,
- <property0> set to 0 = date,
- <property1> set to 2 = opening price,
- <property2> set to 3 = high price,
- <property3> set to 4 = low price,
- <property4> set to 1 = closing price,
- <property5> set to 5 = volume.
For example:

Return currency rates
The currencies cross rates can be used in the STOCKHISTORY () function like for stocks:

The STOCKHISTORY () function returns the historical stock data as an array of requested parameters for the specified period:
= STOCKHISTORY (<stock>, <start_date>, [<end_date>], [<interval>], [<headers>], [<property0>], [<property1>], [<property2>], [<property3>], [<property4>], [<property5>])
Instead, on the <stock> ticker, use the currencies pair.
Return historical currencies exchange rate
By default, the STOCKHISTORY () function for currencies exchange rate returns the array of
- two columns (the default values of <property0> - <property5> - 0,1) Date and Closing price,
- rows of each date from the specified period (the default value of <interval> - 1 = monthly) plus one row for headers (the default value of <headers> - 1 = show headers).
For example:

Return full information for the period
To return full daily data for the specified period, use the following parameters:
= STOCKHISTORY (<stock>, <start_date>, <end_date>, 0, 0, 1),
where:
- <interval> can be skipped or set to 2 = monthly,
- <headers> can be skipped or set to 1 = show headers,
- <property0> set to 0 = date,
- <property1> set to 2 = opening price,
- <property2> set to 3 = high price,
- <property3> set to 4 = low price,
- <property4> set to 1 = closing price.
For example:


